Crypto chart patterns are the road signs of price action: trend lines, support and resistance, head and shoulders, triangles, double tops, and candlestick formations reveal where momentum may pause or accelerate. In the context of AI trading, these patterns are significant because AI models interpret the same signals to time entries, spot breakouts, and manage risk. Want to learn how to read them, trade them, and profit from market trends? This post breaks down pattern recognition, technical analysis, indicators, and simple trading rules, and shows how automation can help you act faster.
Coincidence AI's AI crypto trading bot helps you act faster by spotting patterns, backtesting strategies, and executing trades automatically so you can turn chart study into real results. It simplifies decision-making and lets you focus on learning price action, strategy design and risk control.
Summary
- Over 70% of traders rely on chart patterns for decision-making, which makes pattern detection a primary workflow to automate rather than a niche skill.
- Chart patterns can predict price movements with accuracy up to 80%, but that nominal accuracy only holds when the timeframe, volume confirmation, and strict entry rules are applied.
- More than 60% of successful trades are based on identifying chart patterns, which is why integrating scoring, liquidity checks, and execution rules is essential to turn signals into durable portfolio returns.
- AI-driven pattern recognition has improved data processing speeds by approximately 40%. By 2025, 85% of organizations are expected to adopt AI pattern recognition tools, highlighting how speed and scale are changing, as well as which signals remain actionable.
- Data problems can distort signals, with studies showing that 25% of visualizations are misleading due to improper scaling and 40% of charts use incorrect types. Therefore, cross-checking raw feeds and chart formats is crucial.
- Operational risk is real, so stress tests should include worst-case fills and a 10%-30% adverse move scenario. Rules should be retired after triggers, such as a sustained 30-day drop in hit rate, to prevent fragile edges from persisting.
- This is where Coincidence AI's AI crypto trading bot fits in; it addresses these gaps by converting plain-English pattern rules into deployable strategies while centralizing execution and enforcing liquidity and risk checks.
What are Crypto Chart Patterns?
Crypto chart patterns are recurring shapes that the price makes on candlestick or bar charts, reflecting where buyers and sellers paused, fought, and surrendered. You read them to assign probabilities to future moves, then translate those probabilities into concrete entry, exit, and risk rules you can execute consistently.
Why Do Traders Rely on Patterns?
Most traders consult these formations because they compress crowd behavior into signals you can act on. This matters because early identification helps you plan entries and exits rather than guessing, and that planning is precisely what keeps trades from becoming reactive. Treating patterns as probabilities, rather than certainties, can create frustration and burnout when one person is left to judge every signal under pressure.
How Common Are These Signals in Real Trading Decisions?
Over 70% of traders rely on chart patterns for decision-making, which confirms patterns are a primary lens traders use to read markets, not a niche curiosity. That popularity explains why pattern detection is often the first thing teams automate when trying to reduce manual workload.
Are Chart Patterns Accurate Enough to Trade From?
Chart patterns can predict price movements with an accuracy of up to 80%, but that figure needs context. Accuracy is contingent upon the timeframe, confirmation filters such as volume and indicator agreement, and strict entry rules. In practice, high nominal accuracy still produces losing streaks unless position sizing, stop placement, and execution quality are part of the rule set.
How Do You Turn a Visual Pattern Into a Precise Rule?
Think of a pattern as a hypothesis: It suggests a set of conditions that, when true, tilt the odds. You convert that hypothesis into Boolean rules and numeric thresholds. For example, combine MA crossover conditions with an RSI oversold filter, require rising on-balance volume for confirmation, then attach a fixed fractional position size, a stop loss set to the nearest support, and an automated trailing exit.
When you translate patterns in this way, you remove guesswork and create repeatable behavior that can be backtested and monitored.
What Breaks Manual Pattern Trading at Scale?
Most traders codify strategies manually because it feels direct and controllable. That approach works at first, but as you add more pattern rules and instruments, maintenance multiplies: APIs change, indicators need retuning, and overnight markets produce missed signals while you sleep. The hidden cost is not just missed trades, but also the time and mental strain they incur.
Plain English to Deployed Bots
Platforms like CoincidenceAI convert plain English strategy descriptions into deployed bots, centralize cross-exchange execution, and maintain secure integrations with OAuth, zero-balance access, and end-to-end encryption, compressing what used to take days of engineering into minutes of configuration.
How Should You Combine Patterns with Risk Controls?
If you use pattern triggers without matched risk rules, you amplify variance. Use position sizing tied to stop distance, require multi-factor confirmation to reduce false breakouts, and run forward tests with walk‑forward validation to see how strategies behave in live conditions.
When liquidity is thin, prefer smaller sizes or DCA approaches; when momentum is strong, tighten exits to lock profits. Practically, pairing patterns with disciplined sizing and automated execution reduces the emotional load that leads to exhaustion and lone decision fatigue.
A Short, Simple Picture
Patterns are like footprints in wet concrete; they tell you who moved and roughly where, but not the motive or next step; your job is to convert those footprints into a repeatable plan that includes checks and backups. The following section will surface something that changes how you judge every signal you just learned about.
Related Reading
- What is AI Trading
- Why Is Bitcoin Going Down
- Day Trading Crypto
- Where to Buy Meme Coins
- Is Bitcoin Going to Crash
- Is XRP the Next Bitcoin
- What Is AI Arbitrage
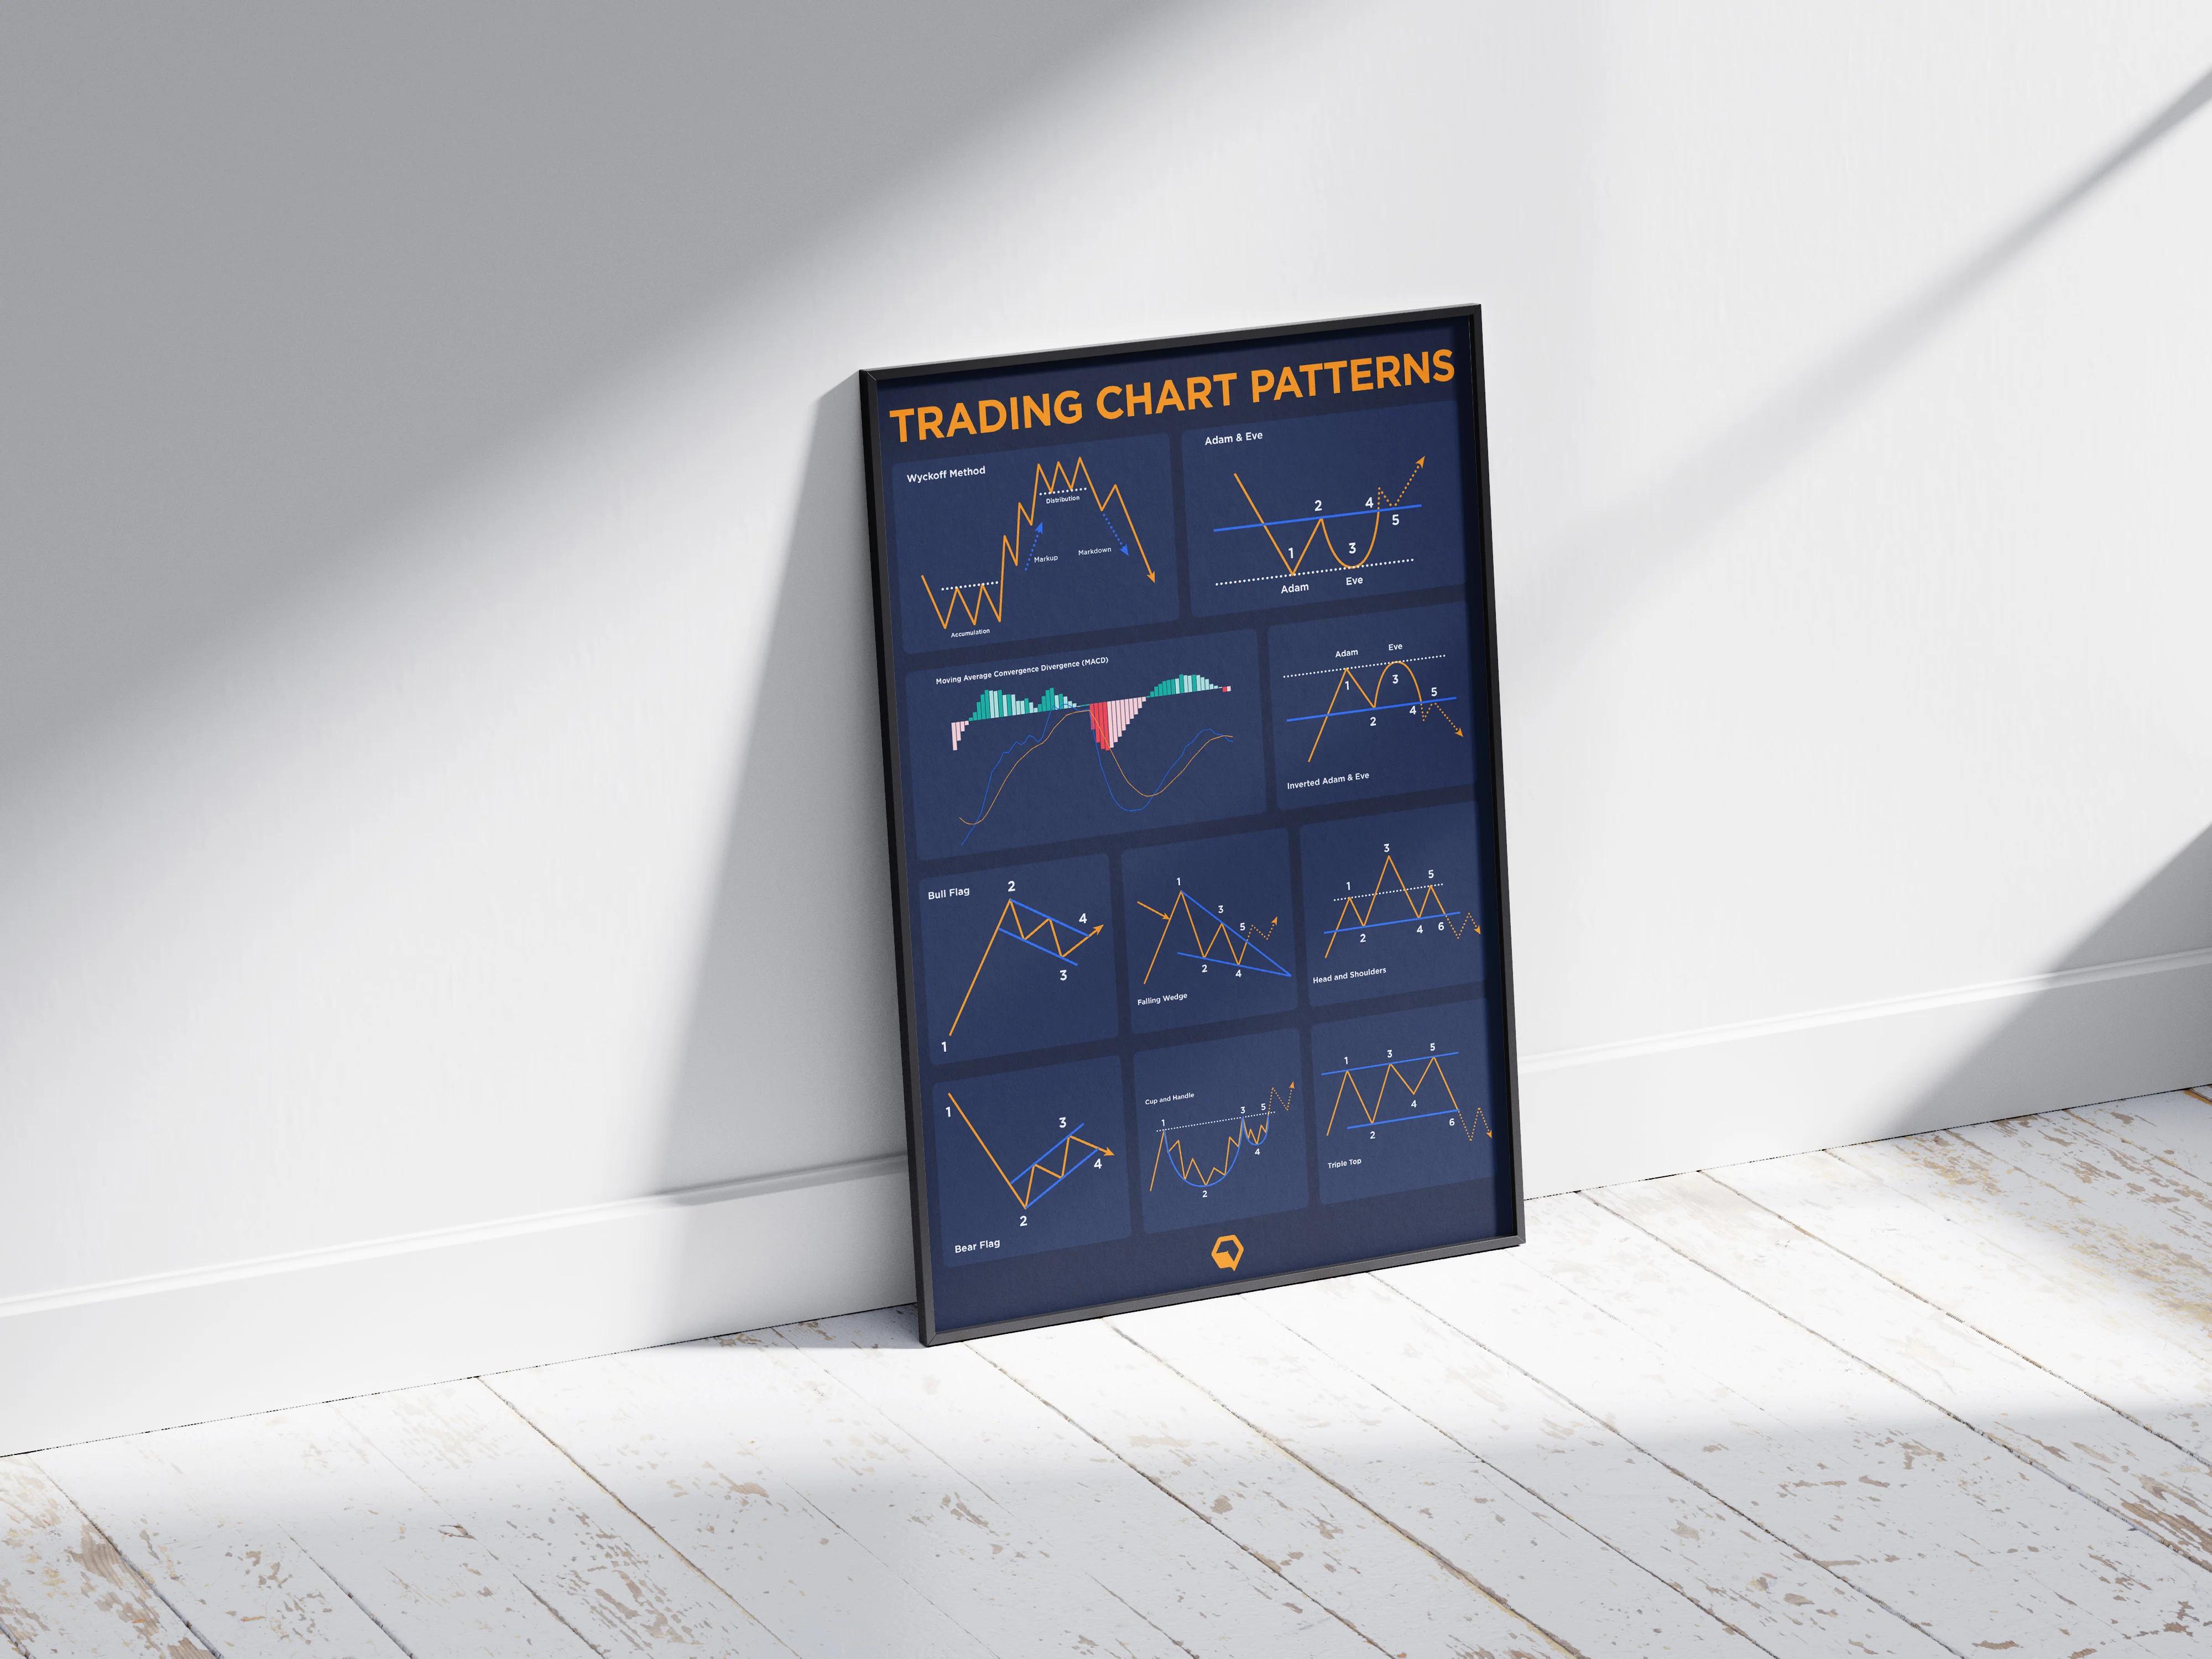
7 Popular Crypto Chart Patterns to Know
1. Bear Flag
Look for a steep decline followed by a shallow, parallel consolidation, then a volume pickup on the break downward. Use the volume decline through the flag as a filter, then require a close below the lower channel line on increased volume before taking action.
Why Traders Get It Wrong
False breaks occur when liquidity thins, especially on low-cap tokens that are manipulated by wash trades. Protect yourself with a volatility‑adjusted stop and a rule that rejects signals on spreads above a threshold.
Good Timeframe
Best on 4H and daily for swing trades, but more miniature flags can also work on 15m for scalps if liquidity is adequate.
Automation Recipe
Combine a linear regression or channel test for the flag, requiring volume to be below the 20-period average during consolidation. Then, require a candle close below the channel and for on-balance volume to turn negative. Attach position size based on the ATR distance to stop.
Plain‑English Rule Example
"When a 4H price decline forms a parallel consolidation and price closes below the lower channel with volume > 1.2x 20‑period average, open a short-sized sized so risk is 1% of equity, stop at 1.5x ATR, take profit at 2x risk."
2. Bull Flag
The mirror image of the bear flag, a sharp run followed by a shallow, downward‑sloping channel, then a breakout above the upper channel with rising volume. Add a momentum indicator, like a 9/21 EMA crossover, as secondary confirmation to cut false breakouts.
Failure Mode to Watch
Call‑to‑action breakouts that fail to attract follow‑through usually lack volume or coincide with resistance. Use a rejection filter that cancels the order if the price fails to hold 1 ATR above the breakout within two candles.
Timeframes
Reliable on 1H, 4H, and daily when paired with an MA trend filter. Automation recipe: channel detection, volume confirmation, and MA trend direction, then DCA rules if the early breakout fades. Plain‑English rule example: "If a 4H candle closes above the upper flag channel and 9EMA > 21EMA and volume > 1.1x, buy with TP 3x risk and stop at the lower channel minus 1.2x ATR."
3. Cup and Handle
The rounded cup should form over a meaningful base, and the handle should be a short, tight consolidation. The breakout above the handle, accompanied by expanding volume, is the actionable signal.
Why Traders Overcommit
The handle sometimes forms as a downtrend disguised as consolidation, leading to failed breakouts. Add a relative strength test, for example, require RSI > 50 or price above a reference MA, to avoid buying into weak moves.
Practical Nuance
Measure the cup depth and use it to size both the target and the stop; more bottomless cups require wider stops, which in turn necessitate smaller position sizes.
Automation Recipe
Detect rounded bottom shape via smoothed lows, flag short sideways handles, require breakout close above handle, plus rising volume, and an RSI filter.
Plain‑English Rule Example
"When a daily rounded bottom completes and price breaks above the handle on volume > 1.3x, enter long with stop at the handle low and target equal to cup depth."
4. Double Bottom
Where this wins: It signals a reversal when the second low holds and the rally clears the neckline with conviction. Confirm with increased volume on the breakout and at least one momentum indicator turning positive.
Observed Trader Behavior
Many retail traders wait too long for the perfect neckline break, missing the move, or they buy prematurely at the second bottom. A two-step approach works better: place a stop entry just above the neckline with a fallback limit if momentum stalls.
Automation Recipe
Detect two lows within a lookback window, compute the neckline, and require a breakout close above the neckline with volume confirmation. Then, size the position by stop distance and volatility.
Plain‑English Rule Example
"If two lows form within 30 days and price closes above the neckline on volume > 1.2x, buy with stop at lower low and set TP to neckline distance."
The High Cost of Familiar Workflows
Most teams detect these patterns manually or patch together alerts because this process is familiar and requires no new workflows. As signals and instruments multiply, maintaining scripts, fixing broken connectors, and policing overnight false positives becomes a chronic drain.
Platforms like AI crypto trading bots convert plain-English pattern rules into deployable strategies, centralize cross-exchange execution, and maintain secure integrations with OAuth and zero-balance access, thereby reducing the maintenance burden while ensuring custody remains protected.
5. Double Top
Two peaks that fail to clear resistance, then a decisive break below the neckline; volume should be higher on the first top than the second and increase on the breakdown.
Common Error
Assuming the second top must be higher to be valid, in practice, a slightly lower or equal second top still deserves the same rejection discipline. Use a momentum divergence filter to strengthen the signal.
Risk Management
Short entries should be sized smaller if liquidity is thin and include a trailing stop if the decline accelerates.
Automation Recipe
Detect two peaks within a lookback, calculate the neckline, and require a close below the neckline accompanied by a volume spike and negative RSI divergence. Then, allocate size according to the risk budget.
Plain‑English Rule Example
"If two daily peaks form and price closes below the neckline with RSI divergence and volume > 1.2x, open a short with stop above the recent swing high and target equal to neckline distance."
6. Head and Shoulders
This pattern typically indicates a durable top, so confirmation and precise neckline measurements are essential. The break below the neckline should be accompanied by volume expansion and confirmation from a trend filter.
Failure Mode
Right shoulder traps can look convincing and then rotate into a sideways market; avoid entering until a close below the neckline plus one additional confirming bar.
Automation Nuance
Compute left shoulder, head, and right shoulder within a timeframe window, require break and a momentum or MA trend flip, and size based on the measured move.
Plain‑English Rule Example
"When left shoulder, head, and right shoulder are complete on daily basis and the price closes below the neckline with volume > 1.25x, short with TP equal to head‑to‑neck distance and stop above right shoulder."
7. Symmetrical Triangle
Treat it as neutral until a breakout direction is confirmed, then use trend bias to weight the expected breakout side. Require breakout close outside the converging trendlines plus volume confirmation, and an MA agreeing with the breakout direction.
Traders’ Misconception
Interpreting symmetrical triangles as inherently bullish or bearish without waiting for the breakout is a frequent source of whipsaws. The safer approach is to predefine both a long and short rule and only activate the side that meets confirmation.
Automation Recipe
Detect two or more lower highs and two or more higher lows forming converging lines, wait for a breakout close beyond lines with volume > average, then execute with a stop at the opposite trendline.
Plain‑English Rule Example
"If a symmetrical triangle forms on 4H, place conditional orders: if price closes above the upper trendline with volume > 1.15x, enter long; if price closes below lower trendline with volume > 1.15x, enter short; stops at opposite line."
Consistency with Core Crypto Patterns
This set is consistent with the broader compilations that traders study, as noted in ZenLedger’s guide to popular crypto chart patterns, which lists these formations as core patterns to master. It also sits comfortably within more exhaustive surveys, such as ITBFX’s overview of top crypto patterns, which highlights additional niche shapes that traders monitor.
The Reliable Pattern Trading Checklist
A practical checklist you should automate for every pattern: require volume confirmation, add a trend filter (MA or momentum), size positions by volatility (ATR), attach a hard stop and a trailing rule, and block signals on poor liquidity or suspicious orderbook behavior to reduce exposure to manipulated tokens. This checklist is the difference between spotting a pattern and trading it reliably over months.
Sizing, Exits, and Liquidity
When traders transition from manual spotting to rules-based trading, the typical pattern emerges: they initially focus on codifying entry triggers, only to learn the hard way that exits, position sizing, and liquidity filters are the proper drivers of sustainable performance. That friction is exactly why solutions that translate plain language rules into live bots, with encrypted connections and zero‑balance approvals, shorten the path from idea to disciplined execution.
Plain English to Pro-Desk Workflow
Coincidence turns your trading ideas into live strategies using nothing but plain English. No coding or complexity, just describe what you want to trade, backtest it instantly on real data, and deploy it live to exchanges like Bybit and KuCoin — built for traders who think in strategy, not syntax. The AI crypto trading bot offers a professional-grade workflow that eliminates engineering overhead.That pattern recognition looks tidy now, but the most challenging part is turning these shapes into rules that survive fundamental markets and human mistakes.
How to Use Chart Patterns in Crypto Trading
You use chart patterns by turning each visual signal into a scored, rule-based decision that passes a brief checklist before any money is moved. Then, you automate execution and risk controls so the process runs the same way every time. Score the pattern, require cross‑checks for liquidity and confirmation, size the position to the stop distance, and let execution rules decide order type and routing.
How Should I Score and Weight Pattern Signals?
Start with a base probability for the pattern, then adjust it with objective modifiers:
- Volume strength
- Higher‑timeframe trend agreement
- Recent volatility
- Orderbook depth
Signal Confirmation Weighting
For example, assign a 30% weight to volume, a 25% weight to timeframe confluence, a 20% weight to momentum agreement, a 15% weight to liquidity, and a 10% weight to news or exchange health. Treat the final score as a trigger gate, not a verdict: only act when the score clears a calibrated threshold.
Run stress tests by randomly varying slippage and spread to see how the expected edge shifts, treating the score as a live probability that requires continual calibration.
What Pre‑trade Checks Stop False Breakouts?
Require a liquidity snapshot, a spread limit, and a volume filter before any entry. If the best bid or ask depth within 1% of the midprice does not cover your intended size, the signal should either scale down according to DCA rules or be rejected. Add a short time window that cancels stale alerts if the breakout does not hold a confirmation candle in the chosen timeframe.
Think of these checks as a physical safety valve: they stop entries that look good on a static chart but will fail when you hit the real market.
How Do Execution Choices Change Outcomes?
Choice of order type matters more than most traders admit. Limit orders with adaptive pegging or a small sliding aggressor reduce market impact on larger sizes, while market orders are fine for micro trades in deep markets.
Mitigating Slippage with Execution Algos
Use execution algorithms when you expect meaningful slippage, and bake a maximum slippage budget into every trade rule so fills that exceed the budget are auto‑cancelled or converted into a smaller, staggered order plan. Simulate fills in backtests by sampling historical spread and depth to avoid optimistic results.
What Portfolio Rules Prevent Overconcentration of Pattern Bets?
Cap exposure by pattern family, asset correlation, and total risk. If several bullish patterns emerge across highly correlated altcoins, treat them as a single exposure and scale the allocation accordingly. Size each trade so that the risk per signal equals a small, fixed fraction of the equity, adjusted by the ATR to reflect volatility.
Track portfolio metrics like concurrent open signal count, realized slippage, and the ratio of pattern win rate to average win size, and set hard limits that automatically pause new pattern entries when drawdown thresholds are hit.
Chronic Maintenance
Most teams detect patterns with alerts and manual checks because it is familiar and feels low-friction. That works early, but as signals multiply, rule exceptions, connector failures, and overnight false positives create maintenance tasks that eat hours weekly.
Plain English to Secure, Live Strategy
Platforms like CoincidenceAI convert plain English pattern rules into deployable bots, centralize cross-exchange execution, and maintain custody safety with OAuth, zero-balance access, and end-to-end encryption, compressing ideas into live strategies while preserving integrations and security.
When Should You Change Rules for Different Market Regimes?
If the average spread or realized volatility increases, tighten confirmation requirements or widen stops, and reduce the size. In low-volatility regimes, prefer breakout filters that require higher relative volume and confirmatory momentum; in high-volatility regimes, favor smaller size and faster exits.
This pattern appears consistently across day and swing traders, where a rule that performed well in a trending month fails in a choppy one because the signal filters did not adapt to regime change.
How Do You Monitor Signals and Iterate Without Overfitting?
Label every signal, successful or not, and log the pre‑trade score, liquidity snapshot, fill details, and outcome. Review these metrics weekly and run Monte Carlo resampling on fills and price paths to estimate realistic equity curves, rather than best-case backtests. Use simple red flags to trigger rule review:
- A sustained drop in hit rate over 30 days
- Rising average slippage
- An increase in the cancel-to-fill ratio.
Treat rule updates like software releases, with a canary period on a small fraction of capital before rolling them out more widely.
Practical Checklist to Automate Now
Require a minimum score for activation, a liquidity depth test, a max spread cap, a confirmation candle, size scaling by ATR, a stop tied to structure, and an execution plan that defaults to adaptive limit orders. Automate alerts when any of those checks fail so you can see why a signal was rejected instead of guessing after a losing trade.
The 60% Success Proof Point
This checklist turns pattern spotting into disciplined trading behavior you can scale without burning out. A final proof point for why patterns matter in portfolios, not just charts: More than 60% of successful trades are based on identifying chart patterns, which is why scoring, liquidity checks, and execution plans need to be part of the same system—not separate chores.That operational gap is where something unexpected occurs, causing certain pattern rules to survive in live markets.
Related Reading
- Why Is Bitcoin Up
- Best AI Trading Bot
- AI Bots for Trading
- How High Can Bitcoin Go
- When Will Bitcoin Crash
- Bitcoin Fast Profit
The Role of AI and Automation in Pattern Recognition

AI and automation serve as the scale and discipline that enable pattern recognition to transition from a handful of good calls to a consistently repeatable edge across markets. They speed detection, remove subjective interpretation, and keep pattern signals synchronized with execution so opportunities are captured rather than missed.
How Do Models Spot Evolving Formations in Real-Time?
Modern systems combine fast time series models and pattern detectors, treating price, volume, and order book snapshots as parallel inputs. Convolutional kernels and temporal transformers pick up shape and momentum cues. At the same time, lightweight feature pipelines normalize for volatility, allowing the same model to track a large-cap BTC pool and a thinly traded alt coin simultaneously.
AI Speed Gains Reshaping Order Routing
This end-to-end pipeline matters because latency is not just a performance metric—it determines which signals are actionable. According to AIIM’s report on AI automation trends, pattern recognition through AI has improved data processing speeds by 40% over the past year. Those speed gains are already reshaping how quickly breakouts can be confirmed and orders routed.
What Are the Common Failure Modes You Must Anticipate?
Models fail for predictable reasons: labels that drift, regime changes, and thin-book manipulation produce false positives, while overconfident models amplify them. The failure pattern emerges when a detector trained on trending months is redeployed into choppy markets and begins flagging noise as a signal.
Human Loop and Retraining
The practical fix is operational, not exotic:
- Maintain a human review loop for edge cases
- Push frequent lightweight retraining on rolling windows
- Monitor hit rates and fill quality daily
This enables the model output to remain a trustworthy signal, rather than a noisy alert stream. This is where traders’ frustration with manual scanning becomes relevant, because when alerts multiply without quality, teams either ignore them or burn time vetting every ping—both outcomes kill edge and morale.
The Compound Maintenance Burden
Most teams handle pattern hunting by bolting scripts and alerts together because that workflow is familiar and has a low upfront cost. What they rarely see at first is the compound maintenance burden: connectors break, thresholds drift, and overnight false positives sap hours and confidence.
Eliminating Routine Upkeep
Platforms like AI crypto trading bots offer a different path; they convert plain-English pattern rules into live strategies, centralize retraining and monitoring, and maintain secure integrations with OAuth, zero-balance access, and end-to-end encryption. This eliminates the routine upkeep that consumes engineering cycles, allowing teams to focus on strategy refinement.
How Should You Govern Models and Signals So They Stay Reliable?
Treat governance like quality control, not bureaucracy. Give every model a signal health dashboard that tracks:
- Hit rate
- Slippage
- Cancel-to-fill ratio
- A confidence decay metric
Run canary deployments on a fraction of capital, log raw inputs for post‑trade forensic, and require a weekly label review where ambiguous signals are corrected and fed back into training.
The Governance Imperative
That operational discipline is driving faster adoption, with reports indicating that 85% of organizations are expected to implement AI-driven pattern recognition technologies by 2025. This growth underscores a key point: without strong governance practices, scaling up only multiplies errors.
Where Do You Actually Capture the Return From Automation?
The most significant returns come from three key areas: consistent signal filtering that reduces emotional overrides, rapid multi-asset scanning that surfaces higher-quality opportunities, and a tight coupling of signals to execution, ensuring that fills match backtests. Think of the system as a radar, not a flashlight; you want a continuous, machine-grade sweep that hands only the most credible blips to a human operator or an automated rule for execution.
Low-latency order routing, adaptive limit tactics, and enforced slippage budgets make the difference between a theoretically profitable pattern and one that pays out after fees and missed fills.
Plain English to Live Deployment
Coincidence turns your trading ideas into live strategies using plain English; no coding or complexity. Just describe what you want to trade, backtest it instantly on real data, and deploy it live to exchanges like Bybit and KuCoin. Built for traders who think in strategy, not syntax, Coincidence's AI crypto trading bot gives you the power of a professional quant desk in a tool anyone can master.That reliability sounds solved, until you see the one operational mistake that quietly erodes every automated pattern edge.
Common Mistakes to Avoid

Common mistakes here are less about spotting shapes and more about how those shapes are created, tested, and trusted. You can be technically correct on the chart and still lose money if your visuals, statistics, exchange feeds, or leverage rules are wrong or ungoverned. Fixing those operational and analytical gaps prevents minor errors from compounding into account-level failures.
Could the Chart Itself Be Lying to You?
Bad axis choices and hidden rescaling change a pattern’s apparent strength, so you must check the raw numbers behind any breakout.
According to OWOX’s report on misleading data visualizations, about 25% of data visualizations are misleading due to improper scaling, meaning an apparently clean breakout on one chart can look like a tame wick on another. Make a habit of toggling between linear and percentage views, inspecting candle wicks, and verifying the same signal on an independent feed before trusting a trigger.
Are You Using the Wrong Visual Tool for the Question You Asked?
Not every chart type answers every trading question, and selecting the wrong one can hide critical behavior. OWOX Blog found that 40% of charts use incorrect chart types, leading to confusion. For example, when area charts smooth away intraday rejections or aggregated bars hide microstructure.
Match the visualization to intention: use raw candles for execution rules, Renko for clean trend discovery, and high‑resolution bars when you need wick-based stop placement.
Did You Unknowingly P‑Hack Your Edge?
Running hundreds of parameter sweeps without proper holdout validation produces attractive but fragile backtests. Treat parameter searches like clinical trials: declare hypotheses upfront, reserve a test window outside the primary analysis, and use bootstrapped confidence intervals to estimate the actual hit rate.
If your “best” parameter set wins only during a narrow regime, assume it is suffering from multiple comparisons and penalize its expected return accordingly.
What If the Market Feeds Itself is Lying?
Exchange data anomalies are a quiet, persistent hazard: stale candles, duplicated trades, or timestamp drift can create phantom patterns. Cross‑validate critical signals across two independent sources, flag rapid midprice divergence, and discard candles with abnormal trade counts before they trigger entries.
Think of it as checking the oil gauge on a long drive; ignoring it risks breaking down far from help.
Scaling Operational Pain
Most teams handle deployment with scripts, chat alerts, and spreadsheets because they are familiar and require no new tooling. That approach works early, but as strategies and exchanges multiply, a single misconfiguration or stale connector can produce outsized pain, ranging from cascading misfills to hours of forensic work.
Reducing Operational Surface and Error
Platforms like CoincidenceAI convert plain-English rules into deployed bots, centralize monitoring and failover, and enforce OAuth, zero-balance access, and end-to-end encryption, thereby compressing routine deployment and reducing the operational surface that causes those errors.
Have You Stress‑Tested Funding, Margin, and Liquidation Mechanics?
Pattern signals frequently assume full fills and clean exits, but leveraged venues and funding spikes behave differently under stress. Run worst‑case fill simulations, including partial fills, widening spreads, and a 10 to 30% adverse move within 24 hours, and measure resulting PnL, margin calls, and realized volatility. Treat liquidation risk as a first‑class parameter when sizing any pattern that uses leverage.
When is a Pattern Retired, Not Tweaked?
A durable process enforces rules as rigorously as it promotes them. Define retirement triggers, such as a sustained 30-day drop in hit rate, a doubling of average slippage, or structural changes, and then archive and version the rule with its historical inputs and post-mortem notes. If a rule returns after retirement, redeploy it behind a canary capital allocation and a fresh out‑of‑time test before restoring full size.You think that fixes the worst mistakes, but there is one operational blind spot that quietly eats performance and trust.
Trade with Plain English with our AI Crypto Trading Bot
When you’re tired of judging every breakout and managing stops under pressure, consider a different path: after building plain‑English to live‑bot flows, we found traders consistently want an AI co‑pilot that ingests multiple signals and removes emotional bias from execution so decisions stay disciplined.
Platforms like CoincidenceAI offer that bridge, and real users back it up. Over 75% of users reported improved trading accuracy with the AI crypto trading bot. Users have seen a 30% increase in portfolio value using the AI crypto trading bot.