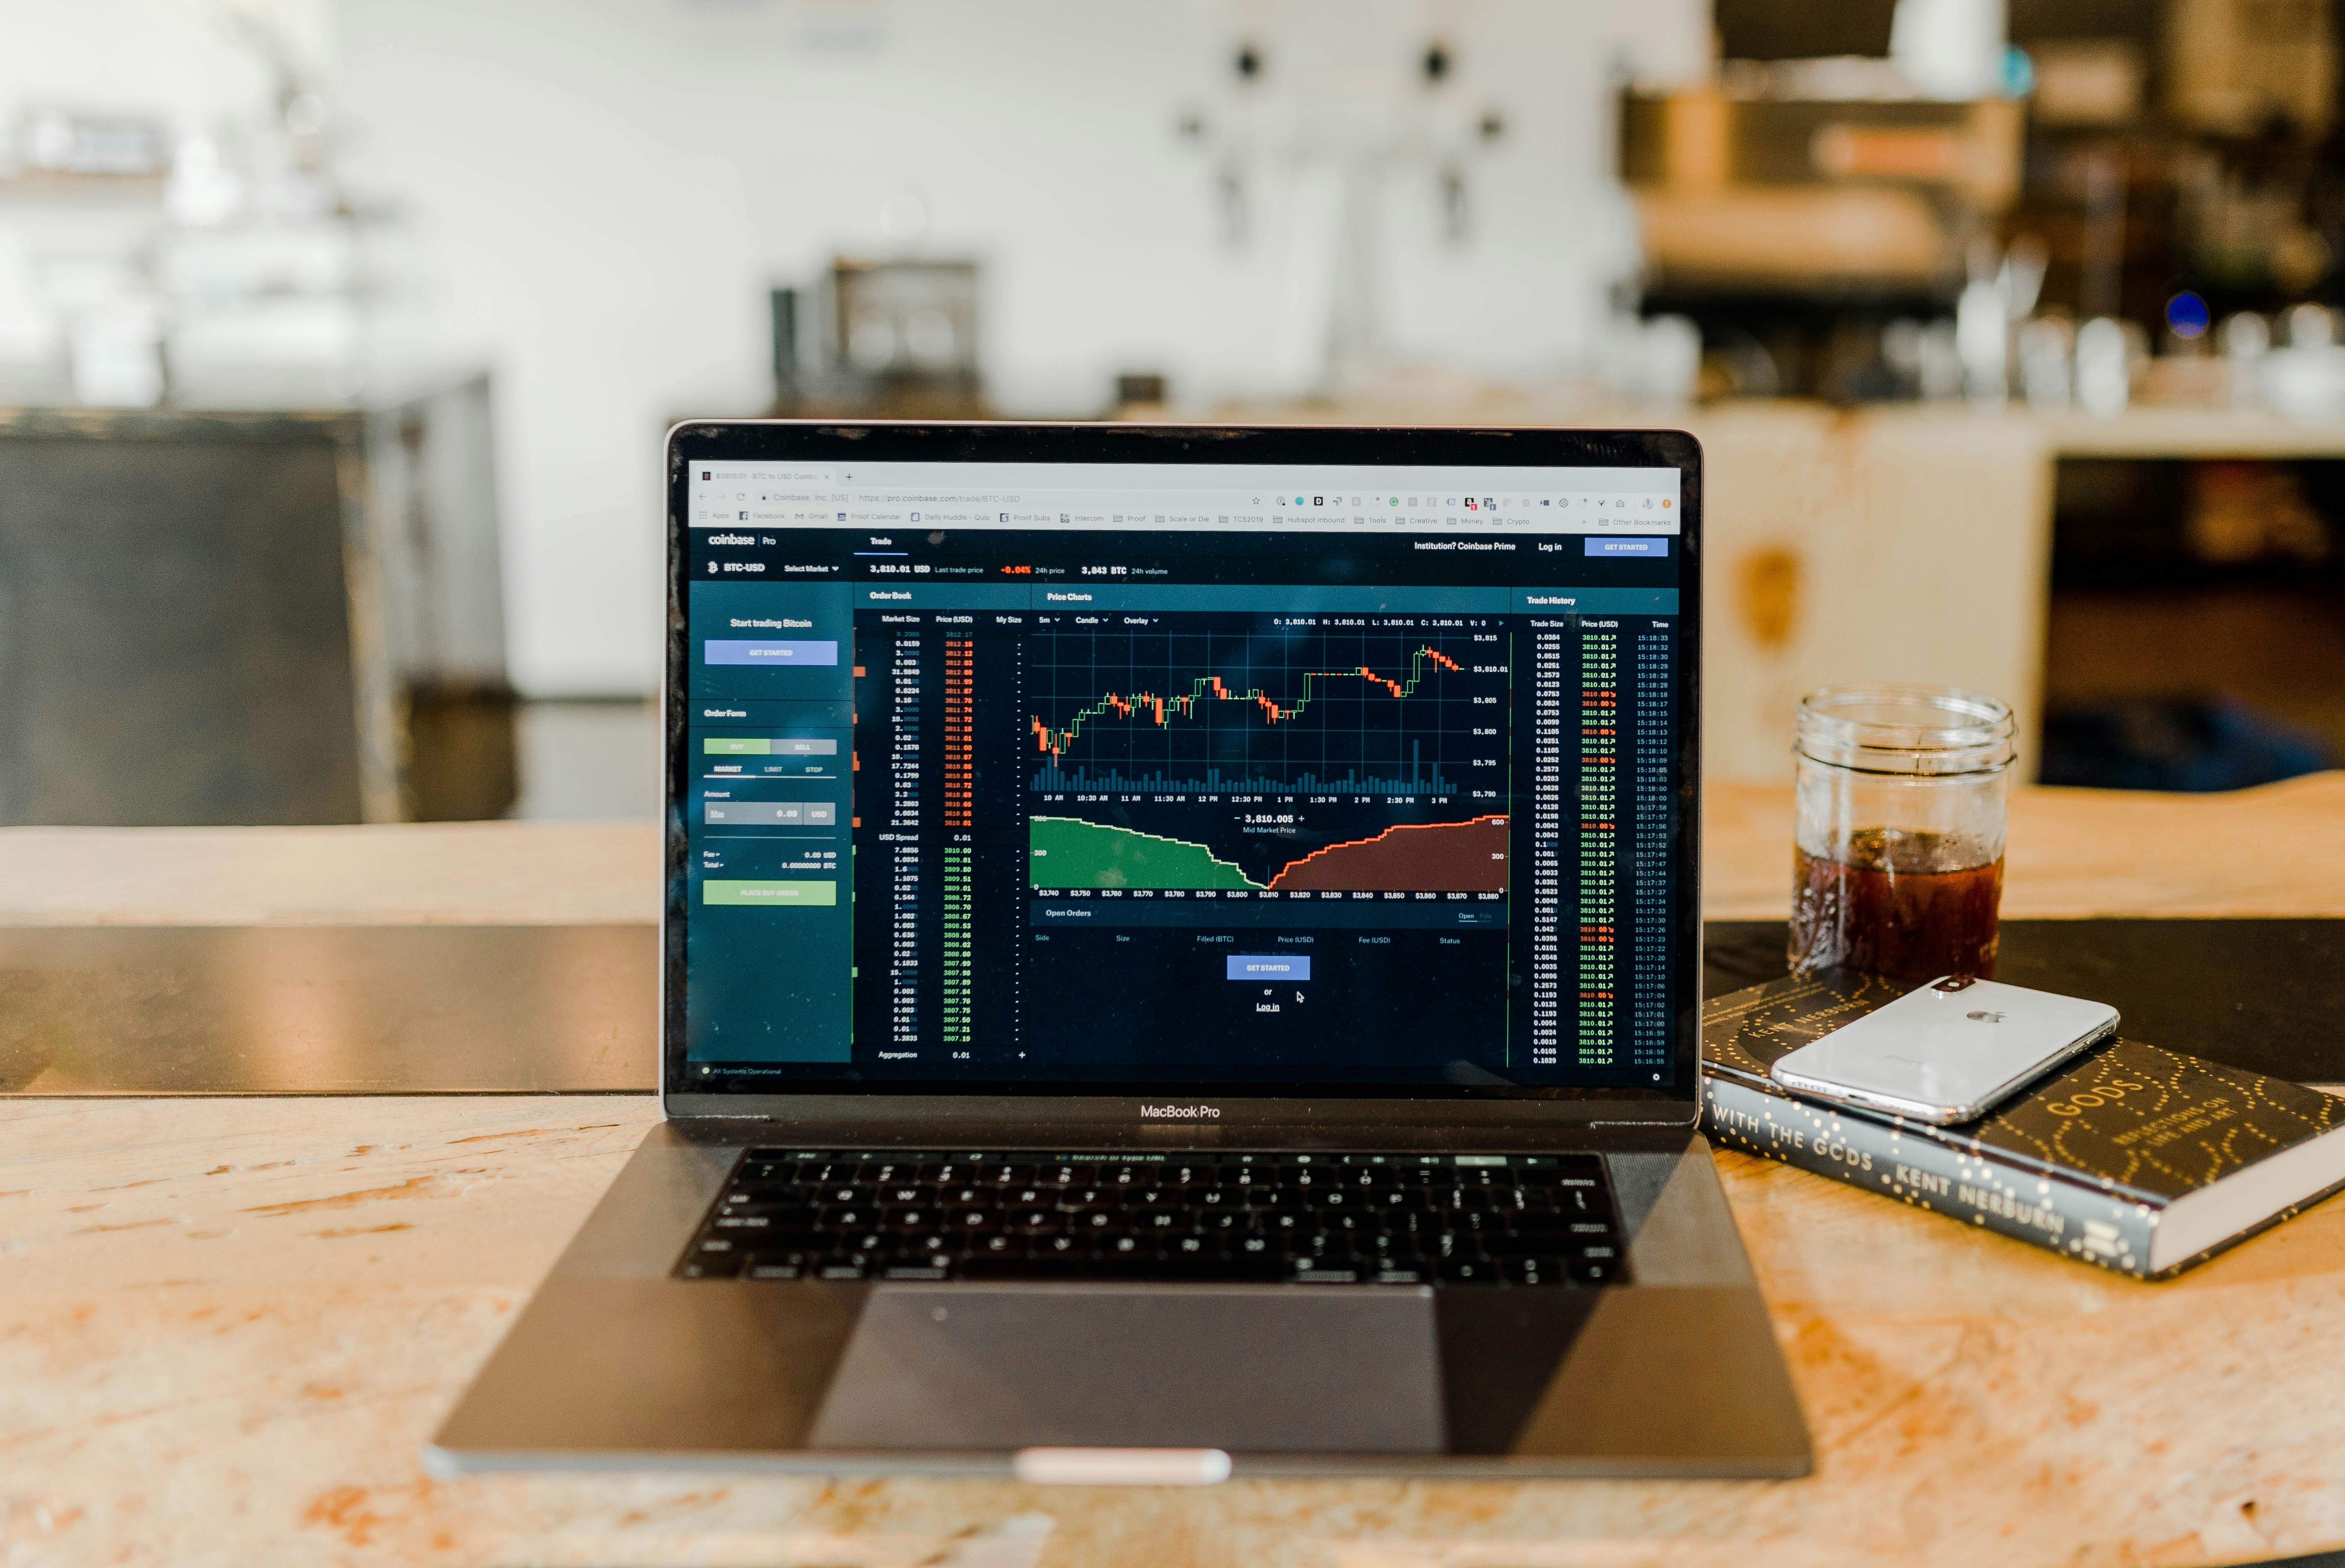
You stare at a chart as prices swing, wondering which move is real and which is noise. Crypto trading patterns, from candlestick formations and head and shoulders to trend lines, support and resistance, volume, and indicators like RSI and MACD, give you a framework to read price action, spot breakouts, and spot reversals. This article shows how to read charts, recognize reliable chart patterns, and set smarter entry and exit points so you trade with clearer signals and better risk management. Are you ready to sharpen your trading edge? If you want a partner that applies those insights in real time, Coincidence AI's AI crypto trading bot monitors charts, highlights pattern signals like breakouts and double tops. It helps you turn pattern recognition into clearer trade decisions.
Summary
- Chart patterns are central to decision-making, with over 70% of crypto traders relying on them, and studies indicating that patterns can improve trading success rates by up to 30%.
- False breakouts are a structural hazard: roughly 70 percent of breakouts are false, and as many as 80 percent of traders fall for them in volatile markets.
- Execution modeling drives real outcomes because if a backtest falls apart when you add a conservative 0.5 percent adverse fill, it will likely fail at live scale.
- Pattern edges are regime-dependent; for example, ascending triangle patterns have a 65 percent success rate in bullish markets, so combine trend filters, volume confirmation, and timeframes before committing capital.
- Crowding amplifies risk; head-and-shoulders patterns are used by over 70 percent of traders; and practical sizing rules, such as capping crowded trades to 25 percent of your usual size, keep a single coordination point from wiping out your plan.
- Operational rigor separates winners from losers: there are 41 cataloged candlestick patterns and over 60 percent of traders use them, yet the real benefit comes from turning patterns into precise, testable entry, stop, and sizing rules with routine revalidation.
This is where Coincidence AI's AI crypto trading bot fits in: converting plain-English pattern rules into backtests with realistic fills and enforcing risk gates such as position sizing and daily loss limits.
What Are Crypto Trading Patterns?

Crypto trading patterns are recurring formations on price charts that reflect collective buying and selling behavior and act as probabilistic signals traders use to:
- Time entries
- Exits
- Risk controls
They are tools for making repeatable decisions, not guarantees, so you should treat them as probability-weighted inputs into a strategy.
How Do These Formations Actually Form, And What Do They Represent?
Patterns arise when price action and volume produce recognizable shapes across timeframes, from five-minute candles to weekly bars. Each formation compresses complex market behavior into a single, readable signal, like a set of footprints that tells you how a group moved through a field.
Read against volume and context, patterns reveal shifts in:
- Conviction
- Exhaustion
- Accumulation
You can then convert into explicit trade rules.
Why Do Traders Put So Much Emphasis On Them?
According to Coincub, over 70% of crypto traders rely on chart patterns for making trading decisions, and pattern literacy is part of how most participants make sense of noisy markets. And research from the same article shows that chart patterns can improve trading success rates by up to 30%, demonstrating that when patterns are applied consistently and tested, they can measurably shift the edge.
That combination of widespread use and measurable lift explains why pattern work often becomes the backbone of both discretionary traders and systematic bots.
What Frustrates Traders About Patterns, And Where Do They Go Wrong?
When we work with active traders over several months, the pattern is clear: they expect prices to behave like laws of nature, and when prices misbehave, frustration and second-guessing follow. That feeling is exhausting, and it gets worse when reporting and disclosure rules muddy the accurate picture of positions and risk.
The failure mode is predictable, the same across manual and automated workflows: treating patterns like certainties, not statistical tools, and lacking guardrails to protect capital when they fail.
Automated Pattern Trading: Security, Safety, And Speed
Most teams handle pattern-based strategies manually because that feels familiar and quick. That works until scaling and real capital sensitivity expose the hidden costs: spreadsheets fragment, execution slippage appears, and converting paper wins to live execution becomes slow and mistake-prone.
Platforms like Coincidence AI show a different path, letting traders describe rules in plain English and spin up testable bots with:
- OAuth/API execution
- Non-custodial architecture
- End-to-end encryption
- Built-in risk controls such as:
- Position sizing
- Daily loss limits
- Circuit breakers
It compresses iteration time while maintaining control and safety.
When Do Patterns Stop Being Useful, And How Should You Protect Against That?
Patterns lose reliability in low liquidity, during regime shifts, or around major news events, because the market structure itself has changed. The remedy is not abandoning patterns.
It is combining them with:
- Confirmation layers
- Complex risk rules
- Multi-timeframe checks
- Rigorous out-of-sample testing
Think of it as listening to several instruments to judge key and tempo, not trusting a single trumpet to carry the song.
How Can You Turn Pattern Ideas Into Testable Rules Without Wasting Weeks Of Engineering?
If you can code, you still benefit from translating pattern observations into deterministic entry, exit, and sizing rules that are backtestable.
When coding is a bottleneck, plain-language strategy builders let you:
- Iterate faster
- Run paper trading
- Add stop gates before you touch real capital
That disciplined pipeline, from hypothesis to paper to guarded live, is what keeps pattern edge real rather than mythical. The real test arrives when you must trust a pattern with real capital, and that decision is more surprising than you expect.
Most Common Crypto Trading Patterns

Building on the definitions you already read, the patterns that matter most are the ones you can turn into clear, testable rules, confirm with volume and liquidity, and size so that a single missed signal does not wipe out your plan.
Focus less on memorizing shapes and more on repeatability, regime fit, and execution constraints, because that is where edge actually survives live markets.
Which Patterns Become Reliable Trading Hypotheses?
Pattern reliability depends on context. High adoption creates self-reinforcing behavior, which helps and hurts at the same time, as crowding makes stops predictable but also raises the chance of fake breakouts; for example, ITB Forex Broker, over 70% of traders use the Head and Shoulders pattern for predicting market reversals, so you must treat it like a coordination point and plan for crowded exits.
In trending markets, specific consolidation patterns tend to perform better; statistically, they are favorable candidates when your regime filters show persistent directional momentum, but you still need volume confirmation and execution rules to avoid being on the wrong side.
How Do These Patterns Fail In Real Trading?
This problem appears consistently in low-liquidity altcoins and during headline-driven churn: big candles with little accompanying volume are often exit liquidity, not confirmation. Stop-hunts and false breakouts exploit impatience.
This is why I insist on at least two confirmation layers before committing capital, for example, a breakout close above resistance, above-average tick volume, and a momentum cross on a higher timeframe. Think of a pattern like a road sign, not a guarantee; it tells you what drivers expect to do, but you still check the mirrors.
How Do You Convert A Pattern Into Deterministic Rules?
If you want a pattern to be testable, write precise entry, stop, and scale rules, then bake them into your execution plan.
Use explicit conditions, for example:
- Entry on candle close above the neckline with volume greater than the 20-period average
- Stop below the last swing low, scale out 30 percent at the measured move
- Apply position sizing so that a single trade risks no more than X% of equity
That rule set should include slippage and fee assumptions, because execution costs change whether you trade spot or derivatives.
From Idea to Algorithm: Accelerating Strategy Iteration
When manual workflows hold you back, most teams test patterns across spreadsheets and piecemeal scripts, which feels familiar and quick, but the hidden cost shows up as inconsistent execution, fragmented data, and slow iteration.
Solutions like an AI crypto trading bot centralize:
- Strategy creation in plain language
- Run backtests with realistic execution assumptions and enforce risk gates, such as:
- Position sizing
- Daily loss limits
It compresses the time from idea to guarded live test.
What Does Robust Statistical Validation Look Like?
Run out-of-sample tests, walk-forward analyses, and sensitivity checks on entry and stop placement, and apply regime filters so you know when a pattern’s edge evaporates. Watch for lookahead bias and sample-size traps; many strategies look good in-sample but collapse when you add slippage and variable spreads. Also check cross-market behavior: a pattern that posts a strong edge on high-cap pairs can fail on thin order books.
And remember, a pattern’s past success in one regime does not guarantee future returns, even if studies show strength in specific conditions, for example, ITB Forex Broker, Ascending Triangle patterns have a success rate of 65% in bullish markets, which suggests they are helpful when trend filters confirm upward bias. Still, they need separate vetting across volatility regimes.
What Practical Checklist Should You Apply Before Trading A Pattern Live?
Confirm liquidity and order-book depth, require:
- Multi-factor confirmation
- Volume
- Momentum
- Higher-timeframe trend
- Define deterministic sizing and risk rules
- Backtest with fees and slippage
- Paper-trade through several cycles before going live
A quick analogy: patterns are signals on a cockpit panel, not the autopilot; they inform a decision, and your risk systems do the flying. This approach keeps strategy work repeatable and defensible, rather than emotional.
Plain English To Live Bot: The Quant Desk For Everyone
Coincidence AI turns your trading ideas into live strategies using nothing but plain English, so you can describe what you want to trade, backtest it instantly on real data, and deploy it live to exchanges like Bybit and KuCoin.
Built for traders who think in strategy, not syntax, Coincidence's AI crypto trading bot gives you the power of a professional quant desk in a tool anyone can master.That explanation settles the how, but the next piece will show the single visual cue most traders miss that turns pattern signals into usable entries.
Related Reading
- Is Pepe Crypto A Good Investment
- Which Crypto Is The Next Bitcoin
- Do You Pay Taxes On Crypto Before Withdrawal
- Where To Buy Presale Crypto
- Can You Make Money Trading Crypto
- How Old To Buy Crypto
- Most Volatile Crypto For Day Trading
- Best Time To Trade Bitcoin
- Day Trading Crypto Vs Stocks
- Forex Trading Vs Crypto Trading
- What Is Wash Trading In Crypto
Candlestick Patterns Every Trader Should Know

They are worth learning only when you can turn them into precise, repeatable trade rules and execution plans, not when you treat them as oracles. The catalog of patterns is extensive, and broad adoption means your edge comes from specificity, execution, and risk control rather than memorizing shapes.
The market has cataloged 41 candlestick patterns, and because over 60% of traders use candlestick patterns for technical analysis, how you operationalize a pattern determines whether it helps or hurts your account.
How Do You Convert A Pattern Into An Execution-Ready Rule?
Start by turning subjective language into exact conditions you can test. Specify which candle closes count, which timeframe confirms, the minimum wick and body proportions, and a volume rule tied to an average.
Then add precise order logic:
- Entry type
- Acceptable slippage
- A discrete stop placement tied to market structure
When we tightened a frustrated trader’s plan, a trader who had been blowing accounts for three years, by enforcing a fixed percent risk per trade, mandatory journaling of every loss, and strict entry confirmation, the behavioral pattern changed: position sizes stopped escalating, and discipline stuck. Think of a pattern as a recipe card, not a rumor; without measurements, outcomes vary wildly.
Which Execution Details Do Most Traders Miss?
They under-model execution. Limit versus market entry, partial fills, taker fees on exits, and the timing of stops during low-liquidity periods all materially change PnL. For example, a pattern that looks clean on a five-minute chart can fail because your market order eats the order book and moves the price, or because funding payments on perpetuals flip expected carry.
Model fills probabilistically, includes realistic slippage in backtests, and simulates partial fills and order queuing, because the theoretical win rate without execution costs is a mirage.
A helpful rule: If a backtest falls apart when you add conservative slippage and 0.5 percent adverse fill, it never worked at an absolute scale.
When Do Patterns Betray You, And How Do You Protect Capital?
Patterns weaken in crowded, low-liquidity, or regime-shifting conditions. They also degrade when traders rely on single-candle confirmations during high-volatility events.
The simplest guard is layered confirmation:
- Higher-timeframe trend
- Volume above a threshold
- A volatility filter that widens stops rather than removing them
Pair this with hard risk gates, absolute daily loss limits, position-size caps, and circuit breakers that pause the strategy after consecutive losses. Those rules don’t feel clever, but they stop one mistake from becoming an account wipe.
What Rigorous Checks Should You Automate Before Going Live?
Automate an out-of-sample holdback, walk-forward windows, and noise tests that randomly jitter prices to see how fragile your edge is.
Add scenario stress tests:
- Simulate a spread blowout
- A 3x volatility spike
- A funding-rate reversal for perpetuals
Require a minimum number of realized trades in paper mode across different market regimes before scaling size.
And instrument trade-level telemetry so every automated action feeds a replayable log for root-cause analysis:
- Order submission
- Reject
- Partial fill
- Top hit
From Manual Error To Automated, Guarded Execution
Most teams do pattern work manually because it feels familiar and fast; that works until execution and risk become real money problems. As complexity grows, manual upkeep fragments rules, execution slips, and psychological bias seeps back into sizing decisions.
Platforms like Coincidence AI provide a third option:
- Teams find that a plain-English strategy builder turns a checklist of candle, volume, and order rules into a testable bot in minutes
- With API execution, non-custodial controls
- Enforced risk gates such as position sizing, daily loss limits, and circuit breakers,
It compresses iteration time while preserving capital protections.
How Do You Pick The Right Timeframe And Universe For A Pattern?
Match the candle timeframe to your holding horizon, and limit the universe to symbols with the depth to absorb your size. Short timeframes amplify noise and execution risk; long timeframes cut signal frequency and increase exposure to macro events.
Use correlation screening to avoid accidental concentration: several pairs that move together are not diversification. Picture tuning a radio: the right station plays clearly when you match the frequency, but if you tune too broadly, you get static and overlap.Imagine a candlestick pattern as a sign on the road, not the steering wheel; you still need hands on the controls and brakes set before you commit. That simple safeguard is valuable until you confront the one failure mode nobody mentions.
Understanding False Breakouts in Crypto

False breakouts are a structural hazard you plan for, not a rare fluke.
They often arise from short-lived liquidity events and algorithmic probing at the order-book level, and a robust response blends:
- Microstructure signals
- Probabilistic detection
- Execution rules that limit the damage when the market fakes a move
What Do Order-Book Mechanics Tell You About A Fake Move?
Pattern recognition shows false breakouts start where liquidity is thin and stops cluster, then get amplified by aggressive taker flow.
Look for three microstructure cues that together raise suspicion:
- A sudden widening of the bid-ask spread with shallow depth on the aggressive side
- A spike in the cancel-to-add ratio in nearby price levels
- A burst of taker volume that fails to draw replenishment from passive liquidity
Picture a crowd pushing on one side of a rope, then everyone letting go at once; the initial shove looks decisive until the rope snaps back.
How Do You Detect A False Breakout Before You Commit To Real Size?
Constraint-based rules cut risk faster than hope. Build detection layers that require persistence across multiple short-lived market features, for example, a sustained order-book imbalance for:
- N consecutive 1-minute bars
- A z-score threshold on minute volume versus the 30-period baseline
- A replenishment rate above X percent of the removed depth
Combine those with an aggressor-ratio filter that checks whether market buys are eating into resting asks rather than simply triggering synthetic volume via cancels. Train a lightweight classifier on these features and run strict out-of-sample tests to determine whether the model flags actual breakouts or just noise.
From Reactive Trading To Real-Time Execution Automation
Most teams watch charts and react after the breakout, because that method feels direct and familiar. That works until the account shows a string of small-to-medium losses and decision-making slows. The hidden cost is time and slippage, not just individual losses, and it compounds when every trade is decided by gut.
Platforms like AI crypto trading bot centralize live order-book telemetry, let teams backtest microstructure filters against real historical fills, and enforce pre-deployment risk gates so the human who spotted the pattern does not have to babysit execution.
What Execution And Hedging Rules Blunt The Pain When A Breakout Fails?
Problem-first: The single worst decision is committing full size immediately on the first aggressive candle. Instead, size entries to available depth, stagger fills with limit orders inside the spread, and attach conditional OCO stop entries that convert to limit rebuys if the move stalls.
Use cross-asset hedges when available, for example, temporarily shorting a correlated liquid pair or buying a short-dated put to cap downside during historically noisy sessions. These are not theoretical; they are practical workarounds that keep a single fake move from erasing a large portion of the edge.
How Should You Measure Whether Your Anti-False-Breakout Rules Actually Work?
Confident stance: Measure the problem directly.
Track:
- The false-breakout hit rate
- The median drawdown following flagged breakouts
- PnL per breakout opportunity
- Execution slippage relative to modeled fills
Run A/B tests in paper mode that compare the baseline plan to the microstructure-filtered plan over the same market slices, then walk the strategy forward across different volatility regimes to catch regime sensitivity.
Why This Matters In Human Terms
When a system flags a likely fake, the trader keeps capital and psychology intact; when it misses, the account pays in both cash and confidence. That real cost explains why IG Bank Switzerland found that approximately 70% of breakouts in the crypto market are false.
It also explains why, in high-volatility windows, MEXC Exchange, 80% of traders fall for false breakouts in volatile markets, because most traders lack automated detection and risked position sizing tied to live depth.
Fast And Guarded: Compressing Idea-To-Live Test Time
If you want the manual workflow but without the late entries and inconsistent execution, the familiar approach is fine early on. Still, as trade frequency and complexity rise, the hidden costs multiply.
Teams find that platforms like AI crypto trading bots compress the time from idea to a guarded live test while keeping audit logs, API execution, and hard limits intact.
Microstructure Checks: Code-Free, Quant-Grade Execution
Coincidence AI turns your trading ideas into live strategies using nothing but plain English; describe the microstructure checks you want, backtest them instantly on real fills, and run them in paper mode until the metrics prove out.
For traders who want disciplined execution without writing a line of code, Coincidence's AI crypto trading bot brings institutional-grade tooling into a workflow you can actually use.That solution sounds tidy, but the next part reveals the single execution habit that separates surviving traders from those who keep getting clipped.
Related Reading
- Best Time To Trade Crypto
- Best Time To Trade Crypto In US
- Bitcoin Vs Crypto
- Crypto Swing Trading Strategy
- Crypto Trading Bot Strategies
- Automated Crypto Trading Strategies
- How To Find Crypto Wallet Address
- How To Buy Presale Crypto
- How To Trade Crypto Under 18
- Best Crypto Credit Cards
How to Trade Crypto Patterns
Treat patterns as executable hypotheses: translate the shape into precise:
- Entry
- Stop
- Sizing rules
Test those rules across time and fills before you risk capital. Add layered confirmations and execution-aware sizing so a single failed signal cannot undo the plan.
How Should I Size Positions When A Pattern Looks Crowded?
When a formation is widely used, crowding becomes the variable that kills otherwise sound setups.
The fix is a score-based sizing rule that converts observable crowding into position limits:
- Combine pattern popularity
- Order-book depth
- Recent stop clustering into a single score
Map that score to a tranche of your maximum allowable risk.
For example, if your score flags high crowding, cap the trade to 25 percent of your usual size and use more conservative stops; when the score is low, allow your standard size. This removes heroics and makes sizing repeatable, not emotional.
What Entry Tactics Reduce False-Breakout Losses?
Problem-first: The worst move is committing full size on the first aggressive candle. Instead, ladder entries into observed depth using limit orders and conditional fills, or use a two-step entry: an initial partial entry at a tight limit, then a follow-up staggered fill as liquidity confirms.
Pair that with an aggressor-ratio check so your fills do not simply chase synthetic volume created by cancellations. This approach lowers slippage and turns a single false shove into a manageable miss.
When Do You Widen Stops Versus Accept A Smaller Edge?
Constraint-based thinking helps here. If realized volatility spikes or the order book thins, widen stops in proportion to short-term volatility and reduce size in proportion, keeping absolute risk per trade constant.
If your volatility-adjusted stop exceeds your risk budget, skip the trade. That rule preserves the edge only when the math lines up, preventing discretionary stop-hunting under stress.
How Do You Test Whether A Pattern’s Edge Is Decaying?
Pattern decay first shows up in subtle metrics, not in headline win rate. Build a monitoring suite that tracks the half-life of signal performance using:
- Rolling 90-day windows
- Median slippage per entry
- The rate of stop clustering around structural levels
Run Monte Carlo resamples of entry timing to see how robust the measured move is to execution noise. If the pattern’s sharp-like statistic falls below your threshold across several windows, retire or rework it before losses mount.
Why Combine On-Chain And Microstructure Signals?
Pattern strength is a function of both market structure and participant behavior. Merge on-chain flows, exchange inflows, and real-time order-book replenishment into your confirmation stack so you know whether a breakout represents fresh demand or just internal book rotation.
Think of it like checking both the river’s surface and its current: one shows where things look good, the other tells you whether they will keep moving.
From Spreadsheet Chaos To Guarded Automated Execution
Most teams keep pattern rules in spreadsheets because it feels familiar and fast. That works until rule versions multiply, backtests diverge, and execution assumptions are misapplied, causing inconsistent live results.
Platforms like Coincidence AI convert plain-English rules into:
- Testable bots
- Enforce realistic slippage and fill assumptions
- Bake in hard risk gates such as:
- Position sizing
- Daily loss limits
- Circuit breakers
- Paper trading
It compresses the time from idea to guarded live while keeping custody and API control intact.
What Metrics Should You Journal For Each Pattern Trade?
Track five concise fields per trade, and they will tell the real story.
Log:
- Entry price
- Effective slippage
- Fill latency
- The crowding score at entry
The post-trade outcome versus your measured-move forecast.
Over 30 to 90 trades, these fields reveal whether:
- Execution
- Timing
- The signal itself broke down
Use those diagnostics to decide whether to:
- Recalibrate stop placement
- Change entry ladders
- Pause the pattern entirely
How Do You Hedge Pattern Exposure Without Killing PNL?
If you trade a pattern that often sees crowded stops, consider temporary micro-hedges sized to expected drawdown during the breakout window, such as offsetting with a correlated liquid pair or short-term options that cap tail risk.
Hedge size should be a function of expected adverse fill slippage, not headline notional, so hedges protect psychology and capital while leaving upside intact.
Crowded Patterns: Managing Slippage and Coordination Risk
Head and shoulders has become a coordination point that frequently concentrates exits, as shown by Crypto Chart Patterns: A Beginner’s Guide to Market Signals, which reports that over 70% of traders use head and shoulders patterns for crypto trading, so treat it as a crowded pattern and tighten your anti-crowding rules accordingly.
Likewise, consider that the same article shows that 25% of crypto traders use ascending triangle patterns, meaning they can work well when trend filters align. Still, they also attract copy trades that worsen slippage.
Trading Rules as Living Artifacts: Revalidate or Retire
Make your rules living artifacts, not wishes. Revalidate measurable assumptions monthly, run walk-forward tests over multiple volatility regimes, and retire patterns when their out-of-sample edge disappears.
A helpful analogy: a trading rule is like a tool in a toolbox; you keep the ones that stay sharp and replace the ones that rust. That clarity holds until you see how the next step turns plain-language strategy into an actual bot.
Related Reading
- Best Ethereum Classic Wallet
- Best Crypto To Swing Trade
- Best Crypto For Long Term Investment
- Best Crypto Platform For Day Trading
- Best Time Frame For Crypto Trading
- Best Months For Crypto
- Best Crypto Algo Trading Platform
- Best Crypto Trading Terminal
- Kraken Alternative
- 3Commas Alternative
Trade with Plain English with our AI Crypto Trading Bot
The truth is, we need controlled experiments and honest execution metrics, not gut calls, to know whether a crypto trading pattern will survive real market friction.
Try Coincidence AI for a short paper run and let a non-custodial, API-driven bot surface real fills, slippage, and risk outcomes so you can decide with data, not hope.